Posts Tagged ‘not a normal cloud’
What’s It All About?
PAGE CONTENTS
THIS – 87,000 Flights each Day – The Skies over Britain – Aviation and the Environment – Climate change – Mechanisms – Total Effect – Radiative Forcing – Vostock Core Samples – Potential reductions – Reducing travel – Kyoto Protocol – Emissions Trading – References for Understanding the Atmosphere
Don’t forget my other pages, links and comments are one click away at the top right of the page…
THIS:

This increase in the number of passengers using UK airports is representative of the world as a whole. It almost exactly also represents the annual number of millions of tons of water deposited as ice in our stratosphere. Where once it was SIX MILLION TONS per year (in 1958), it now (in 2008) is THREE HUNDRED MILLION TONS per year of exhaust ICE that finds its way into our stratosphere as a consequence of Man’s aviation activities*. THAT is what is VISIBLE in your sky when you are complaining about it. NOTHING ELSE. It’s a piffling amount compared with the amount of water vapor ALREADY up there!
* That is three hundred million tons of seed ice. When the stratospheric layer the aircraft is passing through is supersaturated, then the trail may grow by a factor of up to ten thousand times.

87,000 Flights each Day
http://www.natca.org/mediacenter/bythenumbers.msp#1
On any given day, more than 87,000 flights are in the skies in the United States. Only one-third are commercial carriers, like American, United or Southwest. On an average day, air traffic controllers handle 28,537 commercial flights (major and regional airlines), 27,178 general aviation flights (private planes), 24,548 air taxi flights (planes for hire), 5,260 military flights and 2,148 air cargo flights (Federal Express, UPS, etc.). At any given moment, roughly 5,000 planes are in the skies above the United States. In one year, controllers handle an average of 64 million takeoffs and landings.

For every one flight you see listed on an airport monitor, two you don’t see show up on air traffic controllers’ screens. It would take approximately 7,300 airport terminal monitors to show all the flights controllers handle in a single day and approximately 460 monitors to show the number of flights being handled at any one time.

The Skies over Britain
Aviation and the Environment
(From Wikipedia)
Aviation impacts the environment because aircraft engines emit noise, particulates, gases, and contribute to climate change and global dimming. Despite emission reductions from automobiles and more fuel-efficient and less polluting turbofan and turboprop engines, the rapid growth of air travel in recent years contributes to an increase in total pollution attributable to aviation. In the EU greenhouse gas emissions from aviation increased by 87% between 1990 and 2006.
There is an ongoing debate about possible taxation of air travel and the inclusion of aviation in an emissions trading scheme, with a view to ensuring that the total external costs of aviation are taken into account.

Climate change
Like all human activities involving combustion, most forms of aviation release carbon dioxide (CO2) into the earth’s atmosphere, very likely contributing to the acceleration of global warming. In addition to the CO2 released by most aircraft in flight through the burning of fuels such as JP-4 and JP-8, Jet-A (turbine aircraft) or Avgas (piston aircraft), the aviation industry also contributes greenhouse gas emissions from ground airport vehicles and those used by passengers and staff to access airports, as well as through emissions generated by the production of energy used in airport buildings, the manufacture of aircraft and the construction of airport infrastructure.
While the principal greenhouse gas emission from powered aircraft in flight is CO2, other emissions may include nitric oxide and nitrogen dioxide, (together termed oxides of nitrogen or NOx), water vapour and particulates (soot and sulfate particles), sulfur oxides, carbon monoxide (which bonds with oxygen to become CO2 immediately upon release), incompletely-burned hydrocarbons, tetra-ethyl lead (piston aircraft only), and radicals such as hydroxyl, depending on the type of aircraft in use. The contribution of civil aircraft-in-flight to global CO2 emissions has been estimated at around 2%. However, in the case of high-altitude airliners which frequently fly near or in the stratosphere, non-CO2 altitude-sensitive effects may increase the total impact on anthropogenic (man-made) climate change significantly — this problem is not present for aircraft that routinely operate at lower altitudes well inside the troposphere, such as balloons, airships, helicopters, most light aircraft, and many commuter aircraft.
Mechanisms
Subsonic aircraft contribute when aloft to climate change in four ways:
Carbon Dioxide (CO2)
CO2 emissions from aircraft-in-flight are the most significant and best understood element of aviation’s total contribution to climate change. The level and effects of CO2 emissions are currently believed to be broadly the same regardless of altitude (i.e they have the same atmospheric effects as ground based emissions). In 1992, emissions of CO2 from aircraft were estimated at around 2% of all such anthropogenic emissions, though CO2 concentration attributable to aviation in 1992 was around 1% of the total anthropogenic increase, because emissions occurred only in the last 50 years.
Oxides of nitrogen (NOx)
At the high altitudes flown by large jet airliners around the tropopause, emissions of NOx are particularly effective in forming ozone (O3) in the upper troposphere. High altitude (8-13km) NOx emissions result in greater concentrations of O3 than surface NOx emissions, and these in turn have a greater global warming effect. The effect of O3 concentrations are regional and local (as opposed to CO2 emissions, which are global).
NOx emissions also reduce ambient levels of methane, another greenhouse gas, resulting in a climate cooling effect. This effect does not, however, offset the O3 forming effect of NOx emissions. It is now believed that aircraft sulfur and water emissions in the stratosphere tend to deplete O3, partially offsetting the NOx-induced O3 increases. These effects have not been quantified. This problem does not apply to aircraft that fly lower in the troposphere, such as light aircraft or many commuter aircraft.
Water vapor (H2O) Contrails
Aiircraft in flight at high altitudes emit water vapor, a greenhouse gas, which under certain atmospheric conditions forms condensation trails, or contrails. Contrails are visible line clouds that form in cold, humid atmospheres and are thought to have a global warming effect (though one less significant than either CO2 emissions or NOx induced effects). Contrails are extremely rare from lower-altitude aircraft, or from propeller aircraft or rotorcraft.
Cirrus clouds have been observed to develop after the persistent formation of contrails and have been found to have a global warming effect over-and-above that of contrail formation alone. There is a degree of scientific uncertainty over the contribution of contrail and cirrus cloud formation to global warming and attempts to estimate aviation’s overall climate change contribution do not tend to include its effects on cirrus cloud enhancement.
Particulates
Least significant is the release of soot and sulfate particles. Soot absorbs heat and has a warming effect; sulfate particles reflect radiation and have a small cooling effect. In addition, they can influence the formation and properties of clouds. All aircraft powered by combustion will release some amount of soot.
Total Effect
In attempting to aggregate and quantify these effects the Intergovernmental Panel on Climate Change (IPCC) has estimated that aviation’s total climate impact is some 2-4 times that of its CO2 emissions alone (excluding the potential impact of cirrus cloud enhancement). This is measured as radiative forcing. While there is uncertainty about the exact level of impact of NOx and water vapour, governments have accepted the broad scientific view that they do have an effect. Accordingly, more recent UK government policy statements have stressed the need for aviation to address its total climate change impacts and not simply the impact of CO2.
The IPCC has estimated that aviation is responsible for around 3.5% of anthropogenic climate change, a figure which includes both CO2 and non-CO2 induced effects. The IPCC has produced scenarios estimating what this figure could be in 2050. The central case estimate is that aviation’s contribution could grow to 5% of the total contribution by 2050 if action is not taken to tackle these emissions, though the highest scenario is 15%. Moreover, if other industries achieve significant cuts in their own greenhouse gas emissions, aviation’s share as a proportion of the remaining emissions could also rise. Per passenger kilometre, figures from British Airways suggest carbon dioxide emissions of 0.1kg for large jet airliners (a figure which does not account for the production of other pollutants or condensation trails).
RADIATIVE FORCING

The radiative forcing units are in watts per metre squared. The total positive forcing (on the right) amounts to 0.045 W/m2.
This must be compared with the world average insolation of 1330W/m2. It is 0.34 millionths of it.
Insolation values range from 800 to 950 kWh/(kWp·y) in Norway to up to 2,900 in Australia.

A large volcanic eruption would seriously lower this insolation.
VOSTOCK CORE SAMPLES
This is a plot of CO2 concentration, ambient temperature, CH4 concentration, insolation, running backwards in time for 420,000 years. CO2 can be seen to LAG ambient temperature.

Potential reductions
Modern jet aircraft are significantly more fuel efficient (and thus emit less CO2 per unit power) than 30 years ago. Moreover, manufacturers have forecast and are committed to achieving reductions in both CO2 and NOx emissions with each new generation of design of aircraft and engine. The accelerated introduction of more modern aircraft therefore represents a major opportunity to reduce emissions per passenger kilometre flown.
Other opportunities arise from the optimisation of airline timetables, route networks and flight frequencies to increase load factors (minimise the number of empty seats flown), together with the optimisation of airspace. Another possible reduction of the climate-change impact is the limitation of cruise altitude of aircraft.
This would lead to a significant reduction in high-altitude contrails for a marginal trade-off of increased flight time and an estimated 4% increase in CO2 emissions. Drawbacks of this solution include very limited airspace capacity to do this, especially in Europe and North America and increased fuel burn due to jet aircraft being less efficient at lower cruise altitudes. However, the total number of passenger kilometres is growing at a faster rate than manufacturers can reduce emissions, and at present there is no readily available alternative to burning kerosene.
The growth in the aviation sector is therefore likely to continue to generate an increasing volume of greenhouse gas emissions. However some scientists and companies such as GE Aviation and Virgin Fuels are researching biofuel technology for use in jet aircraft. As part of this test Virgin Atlantic Airways flew a Boeing 747 from London Heathrow Airport to Amsterdam Schiphol Airport on 24 February 2008, with one engine burning a combination of coconut oil and babassu oil. Greenpeace’s chief scientist Doug Parr said that the flight was “high-altitude greenwash” and that producing organic oils to make biofuel could lead to deforestation and a large increase in greenhouse gas emissions.
The majority of the world’s aircraft are not large jetliners but smaller piston aircraft, and many are capable of using ethanol as a fuel, with major modifications. While ethanol also releases CO2 during combustion, the plants cultivated to make it draw that same CO2 out of the atmosphere while they are growing, making the fuel closer to climate-change-neutral. The main problems with burning ethanol as a fuel are that it takes more energy to produce than is returned, it displaces food crops and thus raises the price of food and causes soil degradation.
While they are not suitable for long-haul or transoceanic flights, turboprop aircraft used for commuter flights bring two significant benefits: they often burn considerably less fuel per passenger mile, and they typically fly at lower altitudes, well inside the tropopause, where there are no concerns about ozone or contrail production. For even shorter flights, air taxi service using newer, fuel-efficient four- or six-seat light piston aircraft could provide an even lower environmental impact.
Reducing travel
An alternative method for reducing the environmental impact of aviation is to constrain demand for air travel. The UK study Predict and Decide – Aviation, climate change and UK policy, notes that a 10 per cent increase in fares generates a 5 to 15 per cent reduction in demand, and recommends that the British government should manage demand rather than provide for it. This would be accomplished via a strategy that presumes “… against the expansion of UK airport capacity” and constrains demand by the use of economic instruments to price air travel less attractively. A study published by the campaign group Aviation Environment Federation (AEF) concludes that by levying £9 billion of additional taxes the annual rate of growth in demand in the UK for air travel would be reduced to 2 per cent. The ninth report of the House of Commons Environmental Audit Select Committee, published in July 2006, recommends that the British government rethinks its airport expansion policy and considers ways, particularly via increased taxation, in which future demand can be managed in line with industry performance in achieving fuel efficiencies, so that emissions are not allowed to increase in absolute terms.
Kyoto Protocol
Greenhouse gas emissions from fuel consumption in international aviation, in contrast to those from domestic aviation and from energy use by airports, are not assigned under the first round of the Kyoto Protocol, neither are the non-CO2 climate effects. In place of agreement, Governments agreed to work through the International Civil Aviation Organization (ICAO) to limit or reduce emissions and to find a solution to the allocation of emissions from international aviation in time for the second round of Kyoto in 2009 in Copenhagen.
Emissions Trading
As part of that process the ICAO has endorsed the adoption of an open emissions trading system to meet CO2 emissions reduction objectives. Guidelines for the adoption and implementation of a global scheme are currently being developed, and will be presented to the ICAO Assembly in 2007, although the prospects of a comprehensive inter-governmental agreement on the adoption of such a scheme are uncertain.
Within the European Union, however, the European Commission has resolved to incorporate aviation in the European Union Emissions Trading Scheme (ETS). A new directive has been adopted by the European Parliament in July 2008 and approved by the Council in October 2008. It will enter into force on 1 January 2012.
Well, there you are… ….the most relevant aspect of this report is this:
Aviation is responsible for ONLY 3.5% of anthropic climate change, the existence of which is proven.
.
References for Understanding the Atmosphere
Battan, Louis J. 1979. Fundamentals of Meteorology. Englewood, NJ: Prentice-Hall.
Bohren, C. P., and B. A. Albrecht. 1998. Environmental Science. Earth as a Living Planet. New York: John Wiley and Sons.
Charlson, R. J., J. E. Lovelock, M. O. Andreae, and S. G. Warren. 1987. Oceanic phytoplankton, atmospheric sulfur, cloud albedo and climate. Nature 326:655-61.
Fermi, E. 1956. Thermodynamics. New York: Dover Publications.
Gleick, P. H. 1996. Water Resources In Encyclopedia of Climate and Weather, S. H. Schneider, ed. New York: Oxford University Press.
Goody, R. M., and J. C. G. Walker. 1972 Atmospheres. Englewood Cliffs, NJ.: Prentice-Hall.
Hecht, E. 1996. Physics: Calculus. Pacific Grove, Calif.: Brooks Cole Publishing Co.
Hess, S. L. 1959. Introduction to Theoretical Meteorology. New York: Holt, Rinehart and Winston.
Holton, James R. 1979. An Introduction to Dynamic Meteorology. 2nd ed. London: Academic Press Inc.
Lutgens, F. K. and E. J. Tarbuck. 2004. The Atmosphere – An Introduction to Meteorology. Upper Saddle River, NJ.: Pearson Prentice-Hall.
Mason, B. J. 1957. The Physics of Clouds. Oxford: Clarendon Press.
McIlveen, Robin. 1986. Basic Meteorology: A Physical Outline. Berkshire, UK: Van Norstrand Company Ltd.
Penner, J. E., D. H. Lister, D. J. Griggs, D. J. Dokken, and M. McFarland, eds. 1999. Aviation and the Global Atmosphere. Cambridge, U.K.: Cambridge University Press.
Planck, M. 1945. Treatise on Thermodynamics. Translated by A. Ogg. New York: Dover Publications.
Rogers, R. R., and M. K. Yau. 1989. A Short Course on Cloud Physics. 3rd ed. Woburn, Mass.: Butterworth-Heinemann.
Schlesinger, W. H. 1997. Biogeochemistry: An Analysis of Global Change. 2nd ed. San Diego: Academic Press.
U.S. Standard Atmosphere, 1976. Washington, D.C.: U.S. Government Printing Office, 1976.
Wallace, J. M., and P. V. Hobbs. 1977. Atmospheric Science – An Introductory Survey. New York: Academic Press.
Wells, N. 1997. The Atmosphere and Ocean. New York: John Wiley and Sons.

Types of Contrails
PAGE CONTENTS
GROUND LEVEL – EARLIEST PHOTO – WAVE VORTICES – PROPELLER VORTICES – ‘SHOCK’ CLOUDS
Don’t forget my other pages, links and comments are one click away at the top right of the page…
GROUND LEVEL
(TROPOSPHERIC)“ectoplasm and wave vortex”

This aircraft is on approach in humid stormy conditions. Its wheels are down and its flaps are set at fifteen degrees. A temporary “cloud” is visible over the flapped part of the wing indicating the strong pressure reduction caused by the extended flaps, and flowing back from the outermost flap edges is a pair of very strong vortices (“ectoplasm”!) thrown into sharp relief by the clouds of water droplets condensed by the severe reduction in air pressure at their centres. The vortices rise and fall with pressure fluctuations, generated in part by ambient conditions, and also changes in aircraft attitude. Some distance behind the aircraft its wave vortex is remarkably apparent. This is the “mixing engine” that causes contrails to fill supersaturated stratospheric layers.
Why are vortices so stable? Because they spin. Their rotational energy is high, and they can only be brought to a stop by viscous friction between them and the surrounding atmosphere.
The pillar of a tornado is a natural vortex, and is also typically so energetic that water vapor condenses into a “mist” (of water droplets) in the core of its vortex from what one might call the “centrifugal pressure drop” – but one shouldn’t – because the real reason for this condensation is the drop in temperature which occurs as a consequence of this drop in pressure.
THE EARLIEST PHOTO
OF PERSISTENT CONTRAILS (a.k.a. “chemtrails”)

The left-hand side of the picture was probably taken towards the end of August 1940, when the first high-altitude gun battles were being fought between the RAF and the Luftwaffe. The participants were Hawker Hurricanes and Me 109s, which were both fitted with superchargers which enabled them to manoever and fight at around 27,000 ft. The photo is taken over St. Paul’s Cathedral, London. Apologies for the poor state of the picture, but who knows how many times this picture has been copied…
There is a barrack-room lawyer who has claimed the above picture to be fake. If so, then so is this:

Seeing that I am still being spammed by this guy and others, I’m forced to point out the obvious…
These are NOT identical pictures, they ARE of St. Paul’s Cathedral, they are obviously fighter battles, and just as obviously NOT anti-aircraft fire, they AREN’T obscured by much bomb smoke because fighter battles tend to PRECEDE major bombing, as the bombers wouldn’t be able to survive fighter attacks. The defending fighters would have had to be “cleared” first, which is what happened.
As they AREN’T identical, (and yet one can see elements common to both) these pictures VALIDATE EACH OTHER. (I’m not sure that a NASA site would use “made up” material. Why would they need to, in this instance?) They are, of course, NOT the only pictures available for validation either…
The right-hand side of the first picture is a more contemporary copy of St. Paul’s for comparison.

And here is another picture of St. Paul’s, taken somewhat later in the war, where Allied bombers are circling to assemble prior to setting out to attack Germany. In this case one may discern further familiar contrail features such as ice agglomeration, falling, and shear.
WAVE VORTEX (1)

This was originally titled “Cessna Downwash” but a better name for it is “aircraft and its wave vortex climbing through clouds”. The powerful vortex generated by the pressure difference (inflight) between the topside and underside of aircraft wings is responsible for the lift which keeps the aircraft aloft and also the drag which demands the power input from its engines. The wave vortex of a jumbo jet has been known to cause light aircraft to crash five minutes AFTER the jumbo has passed. It causes “distrails” (negative contrails – ice crystal trail agglomeration and descent) and much furore in the “chemtrail community” where it is thought to be some new and misunderstood aspect of “spraying”. In reality it is the “mixing engine” which causes contrails to fill stratospheric layers with ice, and as a consequence, turn blue skies to white skies. (The”chemtrail” community immediately starts coughing!)
Let me quote you one of our “heroes” who calls himself skywitness because he believes himself to be a lone watcher of the skies on the side of the brave and true. (But on the other hand he blocked me immediately from his channel and then pursued me avidly through other channels’ comment boxes, claiming his contrail videos were irrefutable proof of “chemtrail spraying”). He asks:
“I would like to know if anyone has seen a rip in the clouds as it was taking place. Was it something that flew through the cloud, or did it just start to appear out of nowhere? I have seen more than a few of these type of rips or trails, but I have never seen how it takes place…”
All I’m asking is that anyone that knows him and reads this, could you get back to him and put him out of his misery?
WAVE VORTEX (2)

The USAF transport plane has just released its “decoy” flares into what would have been its invisible wave vortex. Chemtrailers in particular have to realise that this twin vortex extends backwards (and keeps rotating!) for at least fifty miles behind the airplane, and also, whether it is visible or not, it is always there.
These flares, by-the-way, are making the only definite “chemtrails” that can be proven to exist. Wherever this smoke falls, it will provide a few plants with a little extra fertilizer…
….Aaaaah. And of course I completely forgot these:

PROPELLER VORTICES
These have also been fervently denied by the relentlessly science-blind as “figments of a feverish imagination”.
Like this:

"figments" from WWII Flying Fortresses
And this:

"Figments" of a C-130 Tanker
And this:

"Figments" of a Kear Cobra helicopter
And this:

"Figments" of a Catalina
‘SHOCK’ CLOUDS
(Also known as a “Mach Cones”):

Stunning!

Mach Cone of today's B-17
Wow! (Conspicuous consumption or what?)

Trails Seen from Space
PAGE CONTENTS
ATLANTIC OCEAN – MID-EUROPE – THE CROW INSTABILITY – MORE ABOUT VORTICES – THE 9-11 VORTEX – THE “THIRD” TRAIL – SUPERSATURATION – “GAPS” – FUEL VENTS – AIRBUS 340 RTO BRAKE TEST
Don’t forget my other pages, links and comments are one click away at the top right of the page…
ATLANTIC OCEAN

A monochrome view of the North Atlantic Ocean by AtlanticSat shows Greenland, Iceland, the British Isles, and part of Norway. Prominent in the photo is a north-south ridge of high pressure, with cold dry air to the west, and warmer wetter air to the east. Aircraft approaching or leaving this ridge have struck permanent contrail conditions on its west side. The trails are at even intervals which suggest there are only TWO great-circle routes involved (London-New York and London LAX) with regular flights from each. The stratosphere (where the trails are) is obviously moving north-to-south.
The trails peter out approaching or leaving the British Isles, where the wetter conditons don’t obtain (for a change).
Chemtrailers must ask themselves why the pilots’ aim was so poor…

MID-EUROPE

Here we are centered roughly over Hamburg; Copenhagen is right center top and the Baltic Sea further to the right. We are looking at a “triangle” of air travel activity between Kiel (center top), Berlin (bottom right) and the Rhineland (bottom left).
You can see evidence that the stratosphere is sliding along at possibly 100kph from the northwest – maybe!
THE CROW INSTABILITY

I originally thought these were local control surface vortices, but I have been better advised since, by Jay Reynolds. Thanks, Jay!

MORE ABOUT VORTICES

The Crow instability is a vortex pair instability, and typically goes through several stages:
– A pair of counter rotating vortices act upon each other to amplify small sinusoidal distortions in their vortex shapes (Normally created by some initial disturbance in the system).
– The waves develop into either symmetric or anti-symmetric modes, depending on the nature of the initial disturbance.
– These distortions grow, both through interaction from one vortex on another, and also ‘Self Induction’ of a vortex with itself. This leads to an exponential growth in the vortex wave amplitude.
– The vortex amplitudes reach a critical value and reconnect, forming a chain of vortex rings.

Initially the vortex pair falls rapidly downward. Perturbations of the vortices from the ambient atmosphere grow in a sinusoidal mutual inductance instability (the Crow instability). Eventually the vortices touch, reconnect and form vortex rings which oscillate, interact with themselves and the atmospheric turbulence and stratification, and finally dissolve. During their lifetime the rings continue to drop, giving rise to the periodic series of puffs often seen in contrail evolution.
These are spin-stabilized and follow the deflected air and take a while to spin to a stop. Ice is precipitated out of the -40 deg C water vapor in the vortex vacua. Altogether an intriguing visual phenomenon!
http://www.cerfacs.fr/cfd/wake_vortex_26.php is a useful reference…
And this low-quality video reveals…
And this high-quality video shows how far our understanding has progressed…
# A vortex (plural: vortices) is a spinning, often turbulent, flow of fluid. Any spiral motion with closed streamlines is vortex flow. …
en.wikipedia.org/wiki/Vortices
Vortices display some special properties:
* The fluid pressure in a vortex is lowest in the center (where the speed is greatest) and rises progressively with distance from the center. This is in accordance with Bernoulli’s Principle. The core of a vortex in air is sometimes visible because of a plume of water vapor caused by condensation in the low pressure of the core. The spout of a tornado is a classic and frightening example of the visible core of a vortex. A dust devil is also the core of a vortex, made visible by the dust drawn upwards by the turbulent flow of air from ground level into the low pressure core.

* The core of every vortex can be considered to contain a vortex line, and every particle in the vortex can be considered to be circulating around the vortex line. Vortex lines can start and end at the boundary of the fluid or form closed loops. They cannot start or end in the fluid. (See Helmholtz’s theorems.) Vortices readily deflect and attach themselves to a solid surface. For example, a vortex usually forms ahead of the propeller disk or jet engine of a slow-moving airplane. One end of the vortex line is attached to the propeller disk or jet engine, but when the airplane is taxiing the other end of the vortex line readily attaches itself to the ground rather than end in midair. The vortex can suck water and small stones into the core and then into the propeller disk or jet engine.

* Two or more vortices that are approximately parallel and circulating in the same direction will merge to form a single vortex. The circulation of the merged vortex will equal the sum of the circulations of the constituent vortices. For example, a sheet of small vortices flows from the trailing edge of the wing or propeller of an airplane when the wing is developing lift or the propeller is developing thrust. In less than one wing chord downstream of the trailing edge of the wing these small vortices merge to form a single vortex. If viewed from the tail of the airplane, looking forward in the direction of flight, there is one wingtip vortex trailing from the left-hand wing and circulating clockwise, and another wingtip vortex trailing from the right-hand wing and circulating anti-clockwise. The result is a region of downwash behind the wing, between the pair of wingtip vortices. These two wingtip vortices do not merge because they are circulating in opposite directions.

* Vortices contain a lot of energy in the circular motion of the fluid. In an ideal fluid this energy can never be dissipated and the vortex would persist forever. However, real fluids exhibit viscosity and this dissipates energy very slowly from the core of the vortex. (See Rankine vortex). It is only through dissipation of a vortex due to viscosity that a vortex line can end in the fluid, rather than at the boundary of the fluid. For example, the wingtip vortices from an airplane dissipate slowly and linger in the atmosphere long after the airplane has passed. This is a hazard to other aircraft and is known as wake turbulence.

Cause and effects
A wing generates aerodynamic lift by creating a region of lower air pressure above it. Fluids are forced to flow from high to low pressure and the air below the wing tends to migrate toward the top of the wing via the wingtips. The air does not escape around the leading or trailing edge of the wing due to airspeed, but it can flow around the tip. Consequently, air flows from below the wing and out around the tip to the top of the wing in a circular fashion. This leakage will raise the pressure on top of the wing and reduce the lift that the wing can generate. It also produces an emergent flow pattern with low pressure in the center surrounded by fast-moving air with curved streamlines. Wingtip vortices only affect the portion of the wing closest to the tip. Thus, the longer the wing, the smaller the affected fraction of it will be. As well, the shorter the chord of the wing, the less opportunity air will have to form vortices. This means that for an aircraft to be most efficient, it should have a very high aspect ratio. This is evident in the design of gliders. It is also evident in long-range airliners, where fuel efficiency is of critical importance. However, increasing the wingspan reduces the maneuverability of the aircraft, which is why combat and aerobatic planes usually feature short, stubby wings despite the efficiency losses.

Another method of reducing fuel consumption is the use of winglets, as seen on some modern airliners such as the Airbus A340. Winglets work by forcing the vortex to move to the very tip of the wing and allowing the entire span to produce lift, thereby effectively increasing the aspect ratio of the wing. Winglets also change the pattern of vorticity in the core of the vortex pattern, spreading it out and reducing the kinetic energy in the circular air flow, which reduces the amount of fuel expended to perform work by the wing upon the spinning air. Winglets can yield worthwhile economy improvements on long-distance flights.
Visibility of vortices due to water condensation and freezing

The cores of the vortices are sometimes visible because water present in them condenses from gas (vapor) to liquid, and sometimes even freezes, forming ice particles. The phase of water (i.e. whether it assumes the form of a solid, liquid, or gas) is determined by its temperature and pressure. For example, in the case of liquid-gas transition, at each pressure there is a special “transition temperature” Tc such that if the sample temperature is even a little above Tc, the sample will be a gas, but if the sample temperature is even a little below Tc, the sample will be a liquid; see phase transition.
For example, at the standard atmospheric pressure, Tc is 100 °C = 212 °F. The transition temperature Tc decreases with decreasing pressure (which explains why water boils at lower temperatures at higher altitudes and at higher temperatures in a pressure cooker; see here for more information). In the case of water vapor in air, the Tc corresponding to the partial pressure of water vapor is called the dew point. (The solid-liquid transition also happens around a specific transition temperature called the melting point. For most substances, the melting point also decreases with decreasing pressure, although water ice in particular—in its Ih form, which is the most familiar one—is a prominent exception to this rule.)
Vortex cores are regions of low pressure. As a vortex core begins to form, the water in the air (in the region that is about to become the core) is in vapor phase, which means that the local temperature is above the local dew point. After the vortex core forms, the pressure inside it has decreased from the ambient value, and so the local dew point (Tc) has dropped from the ambient value. Thus, in and of itself, a drop in pressure would tend to keep water in vapor form: the initial dew point was already below the ambient air temperature, and the formation of the vortex has made the local dew point even lower.
However, as the vortex core forms, its pressure (and so its dew point) is not the only property that is dropping: the vortex-core temperature is dropping also, and in fact it can drop by much more than the dew point does, as we now explain.
To a first approximation, the formation of vortex cores is thermodynamically an adiabatic process, i.e. one with no exchange of heat. In such a process, the drop in pressure is accompanied by a drop in temperature, according to the equation

Here Ti and pi are the absolute temperature and pressure at the beginning of the process (here equal to the ambient air temperature and pressure), Tf and pf are the absolute temperature and pressure in the vortex core (which is the end result of the process), and the constant γ is about 7/5 = 1.4 for air.
Thus, even though the local dew point inside the vortex cores is even lower than in the ambient air, the water vapor may nevertheless condense—if the formation of the vortex brings the local temperature below the new local dew point. Let us verify that this can indeed happen under realistic conditions. For a typical transport aircraft landing at an airport, these conditions are as follows: we may take Ti and pi to have values corresponding to the so-called standard conditions, i.e. pi = 1 atm = 1013.25 mb = 101\,325 Pa and Ti = 293.15 K (which is 20 °C = 68 °F).
We will take the relative humidity to be a comfortable 35% (dew point of 4.1 °C = 39.4 °F). This corresponds to a partial pressure of water vapor of 820 Pa = 8.2 mb.
We will assume that in a vortex core, the pressure (pf) drops to about 80% of the ambient pressure, i.e. to about 80 000 Pa.
Let us first determine the temperature in the vortex core. It is given by the equation above as

Next, we determine the dew point in the vortex core. The partial pressure of water in the vortex core drops in proportion to the drop in the total pressure (i.e. by the same percentage), to about 650 Pa = 6.5 mb. According to a dew point calculator at this site (alternatively one may use the Antoine equation to obtain an approximate value), that partial pressure results in the local dew point of about 0.86 °C; in other words, the new local dew point is about equal to the new local temperature.
Therefore, the case we have been considering is a marginal case; if the relative humidity of the ambient air were even a bit higher (with the total pressure and temperature remaining as above), then the local dew point inside the vortices would rise, while the local temperature would remain the same as what we have just found. Thus the local temperature would now be lower than the local dew point, and so the water vapor inside the vortices would indeed condense.
Under right conditions, the local temperature in vortex cores may drop below the local freezing point, in which case ice particles will form inside the vortex cores.
We have just seen that the water-vapor condensation mechanism in wingtip vortices is driven by local changes in air pressure and temperature. This is to be contrasted to what happens in another well-known case of water condensation related to airplanes: the contrails from airplane engine exhausts. In the case of contrails, the local air pressure and temperature do not change significantly; what matters instead is that the exhaust contains both water vapor (which increases the local water-vapor concentration and so its partial pressure, resulting in elevated dew point and freezing point) as well as aerosols (which provide nucleation centers for the condensation and freezing).
Condensation of water vapor in wing tip vortices is most common on aircraft flying at high angles of attack, such as fighter aircraft in high g maneuvers, or airliners taking off and landing on humid days.

Observations
A vortex can be seen in the spiraling motion of air or liquid around a center of rotation. Circular current of water of conflicting tides form vortex shapes.
Turbulent flow makes many vortices. A good example of a vortex is the atmospheric phenomenon of a whirlwind or a tornado or dust devil. This whirling air mass mostly takes the form of a helix, column, or spiral. Tornadoes develop from severe thunderstorms, usually spawned from squall lines and supercell thunderstorms, though they sometimes happen as a result of a hurricane.

In atmospheric physics, a mesovortex is on the scale of a few miles (smaller than a hurricane but larger than a tornado). On a much smaller scale, a vortex is usually formed as water goes down a drain, as in a sink or a toilet. This occurs in water as the revolving mass forms a whirlpool. This whirlpool is caused by water flowing out of a small opening in the bottom of a basin or reservoir. This swirling flow structure within a region of fluid flow opens downward from the water surface.
Instances

* In the hydrodynamic interpretation of the behavior of electromagnetic fields, the acceleration of electric fluid in a particular direction creates a positive vortex of magnetic fluid. This in turn creates around itself a corresponding negative vortex of electric fluid.
* Smoke ring : A ring of smoke which persists for a surprisingly long time, illustrating the slow rate at which viscosity dissipates the energy of a vortex.
* Lift-induced drag of a wing on an aircraft.

* The primary cause of drag in the sail of a sloop.
* Whirlpool: a swirling body of water produced by ocean tides or by a hole underneath the vortex where the water would drain out, such as a bathtub. A large, powerful whirlpool is known as a maelstrom. In popular imagination, but only rarely in reality, they can have the dangerous effect of destroying boats. Examples are Scylla and Charybdis of classical mythology in the Straits of Messina, Italy; the Naruto whirlpools of Nankaido, Japan; the Maelstrom, Lofoten, Norway.

* Tornado : a violent windstorm characterized by a twisting, funnel-shaped cloud. A less violent version of a tornado, over water, is called a waterspout.
* Hurricane : a much larger, swirling body of clouds produced by evaporating warm ocean water and influenced by the Earth’s rotation. Similar, but far greater, vortices are also seen on other planets, such as the permanent Great Red Spot on Jupiter and the intermittent Great Dark Spot on Neptune.

* Polar vortex : a persistent, large-scale cyclone centered near the Earth’s poles, in the middle and upper troposphere and the stratosphere.
* Sunspot : dark region on the Sun’s surface (photosphere) marked by a lower temperature than its surroundings, and intense magnetic activity.
* The accretion disk of a black hole or other massive gravitational source.
* Spiral galaxy : a type of galaxy in the Hubble sequence which is characterized by a thin, rotating disk. Earth’s galaxy, the Milky Way, is of this type.
# VORTEX – The Verification of the Origins of Rotation in Tornadoes Experiment or VORTEX, field projects study tornadoes. VORTEX1 was the first time scientists completely researched the entire evolution of a tornado enabling a greater understanding of the processes involved with tornadogenesis. …
en.wikipedia.org/wiki/VORTEX
THE 9-11 VORTEX
As explained previously, vortices that come into contact with each reconfigure each other, regenerating intermediate “rings”, and ALL vortices will “stick” to a plane surface – like the ground (tornado), or the face of a building (World Trade Center Tower 2).
The Boeing 767, weighing around 180,000 kilograms and traveling at 260 meters/second, was pulling up in about a 2G banking turn before it struck the tower, so the energy it was putting into its (invisible) WAVE VORTEX was twice the normal, it occurred to me, so might not there be EVIDENCE of its existence in the smoke and dust after the collision?
Evidence there is, in embarrassing plenty. Embarrassing for “no-planers”, anyway, if they were to be well-informed and curious enough to CONTINUE TO WATCH after the collision took place. An oxymoron, I think.

Check back to confirm this if you like…
So now “no-planers” would HAVE to claim that the video artists that “falsified” these images were experts in aerodynamics as well.
To which the answer is OCCAM…
.
THE “THIRD” TRAIL…

In this case the fifth… is the trail left by the APU (Auxiliary Power Unit) which is a normal (but small) gas turbine/electrical generator set. As with the main engines, it burns kerosine to form carbon dioxide and steam. As with the main engines, it leaves a trail. But where’s it coming from?
SUPERSATURATION
“the whole plane is spraying”

When stratospheric air is very clean and stable it may contain MORE water vapour than it does when it is described as having 100% Relative Humidity. The slightest disturbance to it will cause ice crystals to precipitate out of it. It cannot go into super-saturation if there are ANY nucleative materials of any sort in this air.
Here is just such a case, which occurs on occasion in the sub-tropical stratosphere. The trail forms by “burst condensation” into super-cooled droplets which are microscopic initially and can refract sunlight by interference. Over a small space of time these droplets grow progressively as water vapor deposits more supercooled water into them. As they progressively increase their size they run through a progression of light frequencies which they interfere with. This is NOT a refraction effect.
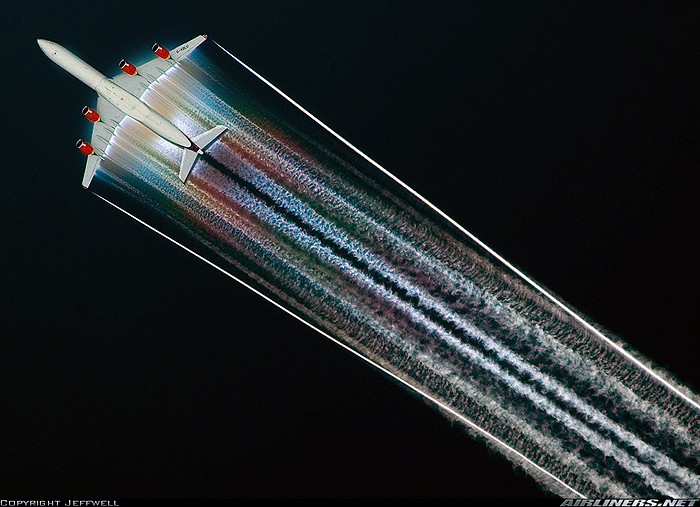
Chemtrailers claim the colors to be indicative of “foreign materials” which is quite the reverse of the truth; only pure water will do this, and only pure air will have become supersaturated in the first place.
The fact that in supersaturated conditions, large aircraft can place thousands of tons of ice into the stratosphere is covered by the paper “Contrails to Cirrus” mentioned in the INTRODUCTION page.
https://jazzroc.wordpress.com/2008/11/22/01-compendium/
“GAPS”

“Gaps” are claimed by chemtrailers as “evidence that planes are spraying”. Such gaps will of course appear in any persistent contrail where the stratospheric air RH falls below 100%. Generally, of course, the humidity tails off gradually, and the transition of trail-to-no-trail is quite indistinct.
In THIS case, the “transition” is a hard and sharp right angle. Too sharp, in fact, for a whirling twin-vortex contrail… Close inspection of the “sky” each side of the “gap” shows it to be comprised of a chemtrailer’s vertical “airbrush strokes”! Naughty!
FUEL VENTS

Here we have an aircraft actually spraying something; it’s fuel. If some in-flight emergency occurs and the plane must make a quick landing, it must first lose weight, for it cannot land at its take-off weight. Some of its fuel must GO.
Chemtrailers are quick to claim this shot as “spraying evidence”.
![]()
6 Porkies
PAGE CONTENTS
6 PORKIES – AEROSOLS – THE ATMOSPHERE – THE WMO – ATMOSNAPS
Don’t forget my other pages, links and comments are one click away at the top right of the page…
“PORK PIE” = “LIE” – Cockney rhyming slang.

6 PORKIES
“Obviously your alleged credentials are fraud” – has your short-term memory passed away? ONE.
“A true person of Science would step forward and lay all questions to rest” – ditto, and I have. Check my comments here. Check http://www.contrailscience.com. Check http://www.myspace.com/jazzroc TWO.
“You do nothing” – I COULD start pasting again… THREE.
“It is safe to assume that people’s claims must have basis” – assuming is the only action you do. Why not educate yourself in science? FOUR.
“I’d like nothing more than for someone to prove nothing is going on” – FIVE.
“You are by far not only a fraud but a coward as well” – GIANT PORKY NUMBER SIX.
AEROSOLS
What a great porky this one is!
The non-scientific word-association goes aerosol – hair spray – sprayers (truly inspirational!)

TO THIS:

But never a thought to CHECKING UP what the REAL MEANING (scientific meaning) of aerosol ACTUALLY IS:
Aerosol – from Wikipedia, the free encyclopedia
Aerosol – contamination in northeastern India and Bangladesh.
Technically, an aerosol is a suspension of fine solid particles or liquid droplets in a gas. Examples are smoke, oceanic haze, air pollution, smog and CS gas. In general conversation, aerosol usually refers to an aerosol spray can or the output of such a can.
The word aerosol derives from the fact that matter “floating” in air is a suspension (a mixture in which solid or liquid or combined solid-liquid particles are suspended in a fluid). To differentiate suspensions from true solutions, the term sol evolved – originally meant to cover dispersions of tiny (sub-microscopic) particles in a liquid.
With studies of dispersions in air, the term aerosol evolved and now embraces both liquid droplets, solid particles, and combinations of these.
Workplace exposure
Concentrated aerosols from substances such as silica, asbestos, and diesel particulate matter are sometimes found in the workplace and have been shown to result in a number of diseases including silicosis and black lung. Respirators can protect workers from harmful aerosol exposure. In the United States the National Institute for Occupational Safety and Health certifies respirators through the National Personal Protective Technology Laboratory to ensure that they protect workers and the public from harmful airborne contaminants.
Effect on climate
Aerosols over the Amazon each September for four burning seasons (2005 through 2008). The aerosol scale (yellow to dark reddish-brown) indicates the relative amount of particles that absorb sunlight. Anthropogenic aerosols, particularly sulfate aerosols from fossil fuel combustion, exert a cooling influence on the climate which partly counteracts the warming induced by greenhouse gases such as carbon dioxide. This effect is accounted for in many climate models. Recent research, as yet unconfirmed, suggests that aerosol diffusion of light may have increased the carbon sink in the earth’s ecosystem.
Recent studies of the Sahel drought and major increases since 1967 in rainfall over the Northern Territory, Kimberley, Pilbara and around the Nullarbor Plain have led some scientists to conclude that the aerosol haze over South and East Asia has been steadily shifting tropical rainfall in both hemispheres southward.
The latest studies of severe rainfall declines over southern Australia since 1997 have led climatologists there to consider the possibility that these Asian aerosols have shifted not only tropical but also mid-latitude systems southward.
Oxides of nitrogen (NOx) in the atmosphere are a form of pollution which can give rise to smog and act as a greenhouse gas. Their persistence in the atmosphere is affected by aerosol droplets of water.
In 1964 long chain fatty acids, either naturally produced from marine organisms dispersed into the atmosphere by wave action or man-made, were found to coat these droplets. In 2006 there was a study of the effect of the LCFA on the persistence of NOx, but the long term implications, although thought to be significant, have yet to be determined.
So AEROSOL means this:

Or this:

A REALTIME study of aerosol presence (made by satellite) all over the world may be obtained here, and here is a representative image, from which you can see the satellite passes 90 minutes apart.

There is a video made over a fortnight showing the main aerosol action occurs travelling westward on a line passing through BANGLADESH and the SAHARA DESERT. It is MAN-MADE – the consequence of many hundreds of millions of humans living close to the poverty line… slash-and-burn, cooking fires, forest fires, vegetable farming decomposition, volcanoes…
No aircraft contrails are found anywhere NEAR this line…
So much for the “chemtrailers” and their “the NWO is poisoning the whole world” theory…

THE ATMOSPHERE
What is it?

It’s a mixture of invisible element and compound gases; nitrogen, oxygen, carbon dioxide, water vapour, argon, neon, and trace amounts of other inert gaseous elements. This mixture keeps us in a healthy condition, and imbalance in this mixture can poison and/or kill us. We would all prefer to be at Standard Temperature and Pressure, which is 20 deg C (70 deg F) and 1000 millibars (14.7 lb/in2).
Standard Temperature and Pressure occur at Sea Level, but the atmosphere may reach up to 200Km or more (the INTERNATIONAL SPACE STATION orbits at 400Km and you can bet there’s very little atmosphere, if any, at that height!) The following diagram is a graph of atmospheric pressure against height over sea level (altitude). The space station height is three graph-heights higher than the graph below.

There is an asymptotic fall-off of pressure with altitude which is easy to see. This, when combined with the concomitant drop in temperature lends weight to the understanding that the stratosphere cannot bear much loading of contrail ice before it saturates, and cannot absorb more.
The region just immediately higher than the tropopause (at approximately 26,000 feet to 39,000 feet) is the region where passenger aircraft fly, for reasons of safety and economy.
The pressure above the tropopause is one-fifth that at sea level, but at the high cruising speed of 550 miles per hour, there is sufficient dynamic lift for safe and stable flight.
This region is the CAUSE of the “chemtrail” controversy, for it is COLD, STABLE, and INCAPABLE of absorbing large amounts of combustion steam as water vapor. As a consequence this steam cools to microscopically-fine ice crystals, which form – TRAILS behind the aircraft.
And the following is a diagram of air dewpoint and temperature plotted against height above sea level (altitude).

If you look at the dewpoint line (on left) you can see it move continually leftward with increase in height above sea level. This powerfully indicates that with increasing height, the atmosphere is increasingly incapable of absorbing the exhaust water formed by burning kerosine in gas turbines.
Looking at the temperature (lapse rate) line on the right, you can see that it moves leftward with increase in height above sea level, until it reaches the tropopause, where it starts to edge to the right again. You can see that after the tropopause the atmosphere gets WARMER with increasing height. The concave shapes to both dewpoint and temperature here indicate some energy input – either solar ‘focusing’ from tropospheric clouds, or jet stream mixing energy – it is hard to guess.
Another couple of points. This chart was obviously made on a cold day; the sea level temperature is just sub-zero. However, two hundred metres higher, and the air temperature is five degrees higher. Bumps and dips in these two lines show where you may infer the presence of clouds.

There is much more to learn about our atmosphere than I have given here, but I can heartily recommend this link to the UK’s Met Office.
After that you can answer these questions (can’t you!).

As further confirmation I strongly recommend AtOptics
 .
.
And a word to the “wise”. There is a lot of scuttlebutt going around which says “Global Warming is just a myth started by our duplicitous governments as a means of extracting additional taxes”. Well I remember a time when it was thought we were headed directly for a new ice age.
(This was just a journalistic ruse. The next Ice Age will occur approximately 16,000 years from the present.)
Since then, it is true that government funds are available for the investigation of GW to the detriment of other research, and that horrible thing “political correctness” has raised its ugly head above the horizon, but the facts are too numerous to mention that the climate is warming, but also that other facts remain unmentioned, which leaves a question of politics…

See “Global Warming is a Myth” under G in this blog.
https://jazzroc.wordpress.com/2008/11/03/19-global-dimming/

THE WORLD METEOROLOGICAL ORGANIZATION
| One of the major purposes of the World Meteorological Organization (WMO), as laid down in its Convention, is “To facilitate worldwide cooperation in the establishment of networks of stations for the making of meteorological observations as well as hydrological and other geophysical observations related to meteorology, and to promote the establishment and maintenance of centres charged with the provision of meteorological and related services”.
Accordingly, WMO Members operate, in a coordinated manner, complex networks in space, the atmosphere, on land and over oceans. In 2007, Members decided to work towards enhanced integration of both the WMO Global Observing System (GOS) and WMO co-sponsored observing systems such as the Global Ocean Observing System (GOOS), Global Terrestrial Observing System (GTOS) and Global Climate Observing System (GCOS). This concept is called the WMO Integrated Global Observing Systems (WIGOS). |
 |
Currently, more than 10000 manned and automatic surface weather stations, 1000 upper-air stations, over 7000 ships, more than 100 moored and 1000 drifting buoys, hundreds of weather radars and over 3000 specially equipped commercial aircraft measure key parameters of the atmosphere, land and ocean surface every day. The space-based component of the WMO Observing System contains operational polar-orbiting and geostationary satellites and also R&D environmental satellites complementing ground-based global observations. These activities are coordinated within the Global Observing System (GOS) of the World Weather Watch (WWW) of WMO. Several WMO Programmes sponsor or participate in the operation of several global observing systems. Other global observing systems, e.g. the global hydrological networks (WHYCOS), function principally on a national or regional level.
Observation programmes such as the Global Climate Observing System (GCOS) and the Global Ocean Observing System (GOOS) will continue to play a major role in improving the collection of required data for the development of climate forecasts and climate change detection. WMO’s Global Atmosphere Watch (GAW) provides data for scientific assessments and for early warnings of changes in the chemical composition and related physical characteristics of the atmosphere that may have adverse affects upon our environment. Through its Instruments and Methods of Observation Programme (IMOP), WMO ensures that meteorological instruments, including manual and automatic ground-based stations and space-based observing systems, are accurate and provide standardized data.
WMO monitoring and observing systems will be a core component of the Global Earth Observation System of Systems (GEOSS), aimed at developing a comprehensive, coordinated and sustained Earth observation system of systems to understand and address global environmental and economic challenges.
ATMOSNAPS
This is, of course, a silly word coined by me to introduce these pictures of Earth’s atmosphere which have been taken by some of the NASA Space Shuttle astronauts from the International Space Station.
I find them most stimulating and interesting. We spend all our time with a “flat-earther” viewpoint, looking up at clouds and failing to see them for what they truly are.

Moment of Launch - "the twang's the thang!"

Shuttle lift-off at Cape Kennedy

Out on a limb...

A massive cumulo-nimbus from above...

A Saharan sandstorm leaves the West Coast of Africa

Eddies form in Cirrus clouds passing over a Mediterranean isle

A sunset from space...
Another Waste of Time
PAGE CONTENTS
ANOTHER WASTE OF TIME – ANDREW JOHNSON – APPARENTLY NOT – ARESOLS – JUMBO FLAME-OUT – BAD SCIENCE
Don’t forget my other pages, links and comments are one click away at the top right of the page…
ANOTHER WASTE OF TIME
![]()
This technically isn’t “chemtrailer” material, but is thoroughly representative of one the “chemtrail” movement’s underlying religious “Ultimate Sacred Postulates”, which is that of “any human government is the work of the Devil, and no good will come of it, and there is no more to think about.”
Unameitltd’s preamble to his videoclip entitled (sic) “Bush’s CIA illegally spys on youtube & myspace users” goes: “CIA publically admits in its pdf document it spys on Americans “citizen media” sites like youtube & myspace. here is their document http://www.fas.org/irp/eprint/naquin.pdf” (I must admit that spelling mistakes make me tense, for they always precede other mistakes!)
jazzroc
Another waste of time…
unameitltd
amazing how many people will defend CIA illegal domestic spying.
jazzroc
Looking at open source material is BY DEFINITION not spying. They have as much right to look at YouTube as YOU do. All activity on YT is PUBLIC. You must be crazy, or uneducated, or BOTH.
unameitltd
Open souce material isnt spying if members of the public do it. However, government is bound by the 4th admendment and needs probable cause and a warrant when their law enforcement INTENT is to look for criminallity. The CIA is banned by law from domestic spying.
jazzroc
If criminality arises in plain view it is the moral duty for ANYONE to do something about it, including YOU, and including a CIA spook (who is ALSO a “member of the public”). What you suggest is a COMPLETE ABSURDITY. Go boil your head…
unameitltd
A CIA spook on the job IS NOT a member of the public, when at work, on a government computer, they are agents of the US government banned by law from ANY spying on Americians. CIA employees may not legally spy on any american, WHAT PART OF THAT DONT U GET?
jazzroc
The illogical part that you suggest. Are you suggesting that BECAUSE someone works for the CIA he is AUTOMATICALLY unable to use YouTube? Since when EXACTLY did PUBLIC mean PRIVATE? Keep your head in that saucepan…

ANDREW JOHNSON
His website “Check the Evidence“
This a hard-working man. Grade A for effort. A pleasure to correspond with, too, at least at first. He holds the classic delusion, but is great on getting evidence. His photographs are of a very high standard. He simply falls down when he attempts to interpret the evidence he so patiently collects. One day, I hope, he will realize his true potential. In the meanwhile it really is such a shame…
Hi – just picking through the site. Wave trails are a natural phenomenon. So are the little downward puffs (great pictures), which are caused by ice accretion, increasing the weight, causing a downward acceleration. This entrains the air. Sometimes you see it happen inside cirrostratus and a “hole” opens in the cloud. A sunset event, quite often, as the dimming sunlight allows the air to cool and bring it closer to supersaturation.
No evidence to back up your assertions. Please send peer-reviewed reference for the persistence of trails for specifically > 2mins (with named and dated case studies and specific atmospheric measurements at the time). Also, list flight details of flights in the case study you are quoting (whether they are test flights, military flights or ordinary civilian flights).
Haha. Very funny. Shirty, eh? http://www-pm.larc.nasa.gov/sass/pub/journals/atlas_JAMC2006.pdf takes care of the nature of contrail deposition, amounts, and quantities over time, and even progression of crystal aggregation. This is the one that tells you, but not directly, that a jumbo can lay down 80,000 tons of ice in six hours of flight…da, da!
Not even NASA would have timed, located and identified the particular aircraft, so I assume from your snitty response you’re going to dismiss it. I’m off to research on your behalf, (seeing that you seem unable) any real findings on fallstreaks and virga. (I’ll give you a tip – always exclude “chemtrails” in your searches if you would like results without speculation or lies in them.)
Google Search Results 1 – 5 out of 645 for “paper” “aviation” “saturated” “atmosphere” “contrails” “-chemtrails” “-aerosols” – Dec 19th 2008.
http://students.ou.edu/J/Thomas.A.Jones-1/contrail.html
http://journals.cambridge.org/action/displayAbstract?fromPage=online&aid=48191
http://findarticles.com/p/articles/mi_hb3101/is_3_54/ai_n29372921
http://ams.allenpress.com/archive/1520-0469/15/2/pdf/i1520-0469-15-2-149.pdf
http://www.informaworld.com/smpp/content~content=a778783829~db=all
I’ll leave you to chase the rest of the 640 results.

“Hole punch”, “fallstreak” clouds with their associated virga, don’t seem to have made it into major scientific research, but there are a few informed quotes about, which, strangely, agree with my analysis. However no flight numbers are assigned to clouds.

Google Search Results 1 – 3 out of 10 for “hole” “punch” “clouds” “fallstreak” “research” “paper” “-chemtrails” – Mar 31st 2009.
www.scribd.com/doc/9841727/Essentials-Of-Meteorology
www.uq.edu.au/_School_Science_Lessons/UNPh37.html
www.met.rdg.ac.uk/bl_met/papers/Wood&Harrison09_ASE.pdf
Now apply these references to your double standards. I’m only doing this because you haven’t read my blog.

"grid" of trails over AJ's house
re: http://www.pm.larc.nasa.gov/sass/pub/journals/atlas_JAMC2006.pdf
Thanks – have flicked through the paper and when time will respond with the problems in it. A very quick look suggests they have taken some data – then not really explained the mechanism as to how “condensation” can last that long – though they have put a couple of nice equations in and stuff (it’s what scientists do to comfort themselves when they don’t know what they’re dealing with).
(NO. That isn’t true at all. Scientific papers are written assuming that the reader understands basic physical science. Such a reader would KNOW that ambient vapor pressure prevents further sublimation of the ice to vapor, and EQUILIBRIUM is reached.
“It’s what scientists do to comfort themselves when they don’t know what they’re dealing with.”
NO. That’s what YOU write when YOU don’t know what you’re dealing with.)
But anyway this one looks better than Ulrich Schumann’s report, as it has more raw data in it. For the moment, I refer to my previous communications about the grid over my house and how no one could give me the flight numbers. Official responses are on my website – but you seem unable to research them….
I will maybe try to contact the NASA authors and ask them how to find out about my grid – and why these trails have gaps in them etc. Perhaps they’ll also be able to explain to me the movements of Hurricane Erin around the time of 9/11 – perhaps they will be coincidence theorists…
Anyway, can you explain this formation for me please:
http://www.checktheevidence.co.uk/cms/index.php?option=com_content&task=view&id=183&Itemid=50
The blue plane one is quite interesting – as the plane is almost certainly below 28,000 feet. A retired Naval Officer reported to me last week how he measured the height of several aircraft as approximately 8,000 feet (using the size of the aircraft and graticule measurements) and making trails. How is this possible? I will post this data when I have it nailed down more.
Would you like to see my photo of a trail in cumulus cloud (in an overcast sky) – probably at about 8,000 feet or so? Taken in Feb. On Sunday I was out for about 2 hours and saw 2 trails – beautiful day. Av ground temp was about 10 or 12C. This morning in 5 minutes, I saw about 20 as I was going to the train station… it was about the was about the same temp in the morning… Oh dear – looks like NASA is not telling us the truth (remember the mars photos you looked at…?)
“will respond with the problems in it.”
Well, it’s very confident of you to suppose there are problems with it at all.
“A very quick look suggests they have taken some data – then not really explained the mechanism as to how “condensation” can last that long – though they have put a couple of nice equations in and stuff (it’s what scientists do to comfort themselves when they don’t know what they’re dealing with).”
Well we all have our comfort zones. Condensation can be perfectly permanent at 100% saturation. It makes me wonder if you understand the technical term “equilibrium”. You haven’t coped with condensation yet. You should look at a Wilson Cloud Chamber. WIKI it.

Wilson Cloud Chamber - AJ
Re NASA paper – another note. All references which refer to contrails, except 1, are post 1994 (and I think post 1996). I found the 1972 paper and it’s an interesting read. I might be able to put together another article to clarify further the misapprehensions that you and many other scientists seem to be labouring under – and the staggering assumptions you repeatedly reel off as if they are fact.
“They forgot to report a Cat 5 hurricane”. Classic – that’s super. re this: “We obviously perceive things very differently from each other. How do you suppose I’ve conducted a career in industrial engineering design with perceptual deficiencies with respect to analyzing space and dynamics?”
Yes – not much point in continuing – when you brush off grids of air craft trails and assume flight paths cross – but provide no evidence. Anyway, how do you suppose I’ve conducted a career in software engineering and software design and education with perceptual deficiencies with respect to analyzing data and developing solutions to engineering problems?
I liked your “shadow of a contrail” – highly entertaining.
Write to NASA and tell them what you think about the dome photos and sending a rover etc – see what response you get. Oddly, then, we share a similar perception about this dome. So why the difference between that and aircraft grids – they’re both “spatial awareness” related aren’t they?
I wrote to the one of the Mars Express team members and they showed little interest. And you didn’t answer why there was such a difference between the USGS and MSSS versions.

aerodynamic and engine contrail - AJ
“clarify further the misapprehensions that you and many other scientists seem to be labouring under – and the staggering assumptions you repeatedly reel off as if they are fact”
They are fact. Perhaps you haven’t operated a Wilson Cloud chamber, run a gas turbine on a test bed, operated a wind tunnel. Water has several quite unusual properties. In fact they’re almost unique. Superheating and supercooling, latent heats of melting and vaporizarion, a specific heat eighty times that of metals.
The Earth’s atmosphere has some unique properties which you haven’t seen fit to acknowledge either, possibly because you remain unaware of them in spite of having had them pointed out to you.
With respect to condensation, I will reiterate to you that it cannot take place even when the atmosphere is in a stable supersaturated state until some “foreign” stimulus initiates it. Which is why an airplane flying through it may trigger a condensation trail. When the atmosphere is in such a stable supersaturated condition it is by definition PERFECTLY PURE: there is not one iota of impurity within it. The condensation clouds start initially as microscopically-fine crystals (so fine as to exhibit diffractive properties) but grow rapidly by progressively-accelerating accretion. Their weight/surface area ratio increases, and their rate of falling does so also. This progressive downward acceleration causes “pendules” (equispaced artificial “virga”) to form in trails. The exhaust gas particulate count greatly exceeds the number of ice condensate crystals that form from the combusted fuel alone, and up to TEN THOUSAND TIMES AS MUCH ICE may be precipitated at the same time. This is why I’m telling you that a single trans-USA jumbo flight may put EIGHTY THOUSAND TONS OF ICE into the sky.

persistent trail of circling airplane beneath temporary trail - AJ
“‘They forgot to report a Cat 5 hurricane’. Classic – that’s super.”
They also left the Eastern seaboard defended by fourteeen fighters which they misdirected elsewhere. That was super, too.
The direction that a hurricane takes is uniquely dependent upon its heat uptake from the sea. The amount of heat it can steal from the sea is equivalent to a 100 megaton thermonuclear weapon, so any unsubtle inferring that the PTB somehow redirected it will earn you my most ribald scorn…
“you brush off grids of air craft trails and assume flight paths cross – but provide no evidence.”
For your information the Earth is an oblate spheroid. Its rotation leaves one with the mistaken impression that the Sun goes round the Earth. If you think the Earth is flat, and the Sun goes round the Earth, why should I “provide evidence”? If you can’t understand “grids” why should I care? Flight paths cross at different heights. That’s what Air Traffic Control is all about. I’ve conducted this same conversation with hundreds over the years. Some people just can’t get it. Try not to be one of them.
“Anyway, how do you suppose I’ve conducted a career in software engineering and software design and education with perceptual deficiencies with respect to analyzing data and developing solutions to engineering problems?”
Extremely badly, by the sound of it. I never had time to pursue chimaeras as you do. Now YOU are my “chimaera”.
“I liked your “shadow of a contrail” – highly entertaining.”
I’ve seen many. Your perception isn’t good. Visit http://www.atoptics.com
A complete understanding of this very good website will do you WONDERS.

A very non-intuitive crepuscular shadow!
“Write to NASA and tell them what you think about the dome photos and sending a rover etc – see what response you get.”
No. I wouldn’t want to be such a dick. I’ll wait until a rover DOES visit the area.
“Oddly, then, we share a similar perception about this dome.”
Well, it DOES look remarkably like a dome. This info’s at least five years old, and I was on top of it at the time. The difference is that I have made mistakes about such “sure things” in the past. They’re in YOUR present. I’m just trying to prevent you from wasting your time here.
So why the difference between that and aircraft grids – they’re both “spatial awareness” related aren’t they?
Well, “looking remarkably like” isn’t BEING. I’ve watched progressive satellite pictures of trails from above. It’s even MORE obvious you’re looking at shuttle flights, in a prevailing wind. You can also see the effects of the moving belts of humid air in the stratosphere which are enabling these trails.
“I wrote to the one of the Mars Express team members and they showed little interest.”
You’re going to sound like a nut even if your interest is sincere. They’re busy, and you’re MAD. (So to speak.)
“And you didn’t answer why there was such a difference between the USGS and MSSS versions.”
Well, it’s a little odd. I see they’re marked as erroneous. That probably means they discard them from run-of-the-mill analysis. Somebody has obviously come along, seen the artefacts, had a go at cleaning them up, thought “****it!”, and discarded the attempt, thinking “There are errors here already”.
Then patient, assiduous, (dare I suggest it?) paranoid people like you come along, find these bits of wreckage, and attempt to “blow them up” as “things NASA doesn’t want you to know“. What utter crap. You seem like a nice guy. Concentrate on REAL issues.

“how is the cloud chamber analogy relevant”
It demonstrates the EXACT MECHANISM by which contrails occur.
“the conditions in question are totally different”
The conditions in question apply exactly. Overall pressure has nothing to do with the phenomenon.
“deadly cosmic rays or radiation from the earth”
Will also produce fine lines of condensate through a saturated sky. These are very fine and disperse instantly.
“Flight data for the grids please”
Do it yourself. Superimpose crossing flight routes from Flight Explorer upon the prevailing wind direction and produce yourself a spiderweb of “grids”.
“thanks for the “new leads” so that I can build up even more powerful data sets and arguments”
Data is not much use to someone whose powers of interpretation are poor. You bore easily. Thanks for your very excellent images.
PS. I have just read through some of your correspondence. It has become quite obvious to me that anything I might say to you has already been said to you by others equally qualified, and that it was a total waste of time beginning a dialogue with you in the first place.
To have a facility with science means being able to understand and interpret the data you gather. It is plain from your failure to understand the use of the word “may”, for instance, that it is in the ability to interpret you are somewhat lacking. But there are many other examples here.
People may pass exams in science (especially these days) without possessing the ability to conduct it, especially as it isn’t easy to examine someone for interpretive ability. The possession of fact concerning a matter of science is quite subservient to the possession of this power to INTERPRET. This power advances science. When this occurs to you, I would like to be a fly on the wall…
It will one day, for you are a hard-working individual.
All very well – but no one in the UK can give me the flight numbers for the day of the grids – that’s official. You have focused your attention on me as if I am “a lone voice” – I am not. Take a look at Rosalind Peterson’s site for example, California Skywatch – she worked for the US Govt.
Cliff Carnicom did the same.
Deliberate misinformation is being promulgated by some people who should know better (Ted Tweitmeyer claimed a refuelling pod on a plane was a chemtrail sprayer – he runs a website called Data4science).
http://www.rense.com/general81/ddthr.htm
20 people (some of whom I have never met) wanted to countersign my report when I’d compiled it. Why? Probably because they regard my interpretation of the raw data as more correct than yours and those officials who claim to know all about what is going on in our skies. None of them, when given the opportunity, have been able to provide the basic data I asked for.
None of them have sufficiently explained the video I sent you with the chemtrail and the contrail in the same part of the sky on the same day, at the same time. It is precisely these sorts of scenarios which are missing from that NASA study you sent (and the others I have looked at).
It is precisely the interesting and unexplained data on Mars which is ignored or ridiculed by those who are paid to investigate such. It is precisely the hexagonal craters on Iapetus that are ignored and glossed over. It is precisely the hexagonal pattern in the atmosphere of Saturn that is ignored and overlooked as some kind of irrelevance.
Studying these patterns – and those in the 9/11 data – along with former Professor of Mechanical Engineering Dr Judy Wood have lead me to a new understanding of the world we are enslaved in. Some people find the cage more appealing than the universe outside the cage – that’s up to them to live in it if they wish. The truth has indeed pissed me off, but it has also set me free and I am working hard to show others were the weak points in the cage bars are (there are many) and they can break them if they wish – or at least yank and rattle them.
Here’s a saying I coined: “By ignoring any amount of data/evidence, it is possible to come to any desired conclusion. However, the value of such a conclusion will be inversely proportional to the amount of evidence ignored.”

“All very well – but no one in the UK can give me the flight numbers for the day of the grids – that’s official.”
I dare say they simply didn’t believe the effort justified the results. You must be aware of the vast numbers of crossing flight routes and flights involved. And that the flight control system is primarily concerned with real-time control. It must store records, that’s true. But to dig them out simply because an inquirer cannot comprehend how grid patterns may occur – is a waste of time.
“You have focused your attention on me as if I am “a lone voice” – I am not. Take a look at Rosalind Peterson’s site for example, California Skywatch -she worked for the US Govt.”
And I for the British. I have heard and seen some of her reasoning. I disagree with her too.
“Cliff Carnicom did the same.”
You really don’t read the work of people that disagree with you, do you?
“Ted Tweitmeyer claimed a refuelling pod on a plane was a chemtrail sprayer – he runs a website called Data4science.”
He too gets a mentch on my blog.
“20 people (some of whom I have never met) wanted to countersign my report when I’d compiled it. Why? Probably because they regard my interpretation of the raw data as more correct than yours and those officials who claim to know all about what is going on in our skies. None of them, when given the opportunity, have been able to provide the basic data I asked for.”
It doesn’t surprise me that others also misinterpret data as you do. However a check out with WIKI on TROPOSPHERE, TROPOPAUSE, STRATOSPHERE, (and all the links contained within) should be sufficient to cause you to reinterpret your data, IF YOU UNDERSTAND WHAT IS WRITTEN THERE.
“None of them have sufficiently explained the video I sent you with the chemtrail and the contrail in the same part of the sky on the same day, at the same time. It is precisely these sorts of scenarios which are missing from that NASA study you sent (and the others I have looked at).”
See above.
“It is precisely the interesting and unexplained data on Mars”
Covered.
“the hexagonal craters on Iapetus”
Natural. (Fingal’s Cave? There are hexagonal piles all over the Canary Isles, where I live.)
“hexagonal pattern in the atmosphere of Saturn”
A standing wave…
“we are enslaved in”
Woah!
“Some people find the cage more appealing”
Society’s dysfunctionality is moderated by Man’s mortality…
“The truth has set me free”
But untruth does the reverse.
“Here’s a saying I coined: ‘By ignoring any amount of data/evidence, it is possible to come to any desired conclusion. However, the value of such a conclusion will be inversely proportional to the amount of evidence ignored.'”
Amen. Here’s to irony…

another shadow of a trail by AJ
Oops – you’re making false statements again… “I dare say they simply didn’t believe the effort justified the results. You must be aware of the vast numbers of crossing flight routes and flights involved. And that the flight control system is primarily concerned with real-time control. It must store records, that’s true. But to dig them out simply because an inquirer cannot comprehend how grid patterns may occur – is a waste of time.”
I completed an FOI to the CAA and the Dept transport – the response was “We don’t have the information you asked for” it wasn’t “we aren’t able or can’t be bothered to get it for some schmuck from Borrowash”. This is why our interpretation differs – and it illustrates again your willingness to ignore published data…. Standing wave? Where is the scientific study that shows this happening in the atmosphere of large gas-giant planets. More really wild assumptions on your part. Amazing behaviour! So is Iapetus made of Basalt? Hmmm – NASA say it’s “mostly ice”. Of course, we can *assume* it happens to be basalt where the craters are. We can assume anything – so why have science and measurements – if we just assume we are right, we don’t ever need to measure anything. Anyway, your original blog title was most apt “Jazzroc vs Chemtrails”….yep – that was the size of it!!
Oops – you’re making false statements again…
I haven’t made any false statements yet, so there’s no “again”. Whatever you were told, they may have lied to you. Records must be kept in the event there is an incident. It could be that after six months, or some other arbitrary interval, they are then discarded, but until then they will be kept.
I completed an FOI to the CAA and the Dept transport – the response was “We don’t have the information you asked for” it wasn’t “we aren’t able or can’t be bothered to get it for some schmuck from Borrowash”.
LOL. Great figure of speech. 🙂
“This is why our interpretation differs – and it illustrates again your willingness to ignore published data…”
You ignore it all the time by your interpretive failure. I wouldn’t claim to be infallible either – I’m not – but I’m just a smidgeon ahead of you.

“Standing wave? Where is the scientific study that shows this happening in the atmosphere of large gas-giant planets. More really wild assumptions on your part. Amazing behaviour!”
I don’t need a “scientific study”. My scientific understanding tells me it’s a standing wave because it’s a pattern I have seen before. Standing waves exist in all compressible atmospheres, unless they’re absolutely at rest. Scientific understanding may well be amazing behaviour to you if you don’t possess it. Have you checked Saturn references thoroughly? I dare say you have – it’s a useful tool, persistence. If nobody else has anything to say about it, then you heard it from JazzRoc first – it’s a STANDING WAVE.
“So is Iapetus made of Basalt? Hmmm – NASA say it’s “mostly ice”. Of course, we can *assume* it happens to be basalt where the craters are. We can assume anything – so why have science and measurements – if we just assume we are right, we don’t ever need to measure anything.”
No, I was simply arguing that hexagonal features are NATURAL. What those most exactly resemble are the regular hexagonal features and “sinkholes” found in permafrost on Earth.

“Anyway, your original blog title was most apt “Jazzroc vs Chemtrails”… yep – that was the size of it!!”
It IS about the size of it, exactly.
WIKI: “A persisting hexagonal wave pattern around the north polar vortex in the atmosphere at about 78°N was first noted in the Voyager images. Unlike the north pole, HST imaging of the south polar region indicates the presence of a jet stream, but no strong polar vortex nor any hexagonal standing wave.”
Shame. Someone beat me to it.
Here I quote the nub of Andrew’s difficulties:
Since contrail persistence requires at least ice saturation, a sky full of contrails but without natural cirrus shows that cases occur with humidity above ice-saturation but below the threshold for cirrus formation.
Andrew’s reply to this is: “This is not an explanation – it is a statement that ‘something happens’. It says that trails can persist without supersaturation – so, supersaturation cannot be the sole explanation for the formation persistent trails. The phrase is really, again, saying ‘persistent trails form, but we don’t know why’.”
But the answer is simple: between normal (dry-ish) air and supersaturated air there is saturated air. This is QUITE SUFFICIENT to prevent the ice crystals of the trail from sublimating away. Somehow Andrew has forgotten this. His conviction (that the Powers That Be are nefarious) prevents him from seeing this. All he waits for is some apparent perceived inconsistency. Once he gets this, his fears are confirmed, and he closes down rational thought.

It isn’t his only vice.
If I argue with him that it is only reasonable to suppose (for it is true) that crossing aircraft routes will produce “grids” in the sky on occasions, then he demands that I supply him with the SCHEDULING of these flights. It is as if I had become suddenly to him the REPRESENTATIVE of external officialdom, instead of a friendly stranger trying to give him good advice.
And then there is his petty-fogging “attention to detail”; adjusting the deckchairs on his Titanic by “counting” his “evidence”. He should learn to EVALUATE his evidence before counting it. Sadly, his skills there are lacking, and he lacks the means of countering that.
“Flight data for the grids please”
“you didn’t answer why there was such a difference between the USGS and MSSS versions”

Fallstreak Virga over my apartment, El Medano, Tenerife
APPARENTLY NOT
“Chemtrails have been controversial since 1999.”
In eight years SOMEBODY would have DIED! ….APPARENTLY NOT
A “chemtrail analyzed”, an “employee” infected? ….APPARENTLY NOT
“Chemtrail material” in crashed plane? ….APPARENTLY NOT
ANY EVIDENCE AT ALL? ….APPARENTLY NOT
ARESOLS
How old are you, sniker?
How did you escape Science class?
“sorry, but” – but nothing. You’re just plain sorry.
“if there was a layer of humidity the trail would not form!” – ALL AIR IS HUMID, SO WHAT YOU SAY IS BULLFEATHERS
“They only form above 30,000 feet or so where the humidity is low!” – Yep, you escaped. Stratospheric air (at MINUS FORTY degrees!) STILL contains moisture. It may even be SATURATED with water vapour, even though it contains LESS MOISTURE than tropospheric air. When it IS saturated, contrails PERSIST, and drift to form CIRRUS clouds.
“Aresols like barium” – Barium is an ELEMENT, not an ar****le. (Oh, I see you meant AEROSOL). It is an ALKALINE EARTH METAL. It is NOT an aerosol. The jet engine would GO OUT if barium (oxide) dust passed through it.
“a metallic salt can extract moisture from 30-40% humidity instead of the 70 for normal cloud formation!” – “Normal”? Tropospheric clouds? But we’re talking STRATOSPHERE mate if we’re talking about CT videos on YouTube. There’s been NO tropospheric trail recorded in YouTube, ever. And the word you never found is HYGROSCOPIC…
“Trails should form and dissipate or not form at all!” – No, it’s your THOUGHTS that should do all of that.
JUMBO FLAME-OUT DUE TO VOLCANIC DUST
BAD SCIENCE
Six months after checking ALL YouTube “Chemtrail” websites I have found NOT ONE IOTA OF PROOF regarding CHEMTRAILS.
They all think they’ve proved it because they TELL EACH OTHER that it’s so.
SEVENTY-THREE SITES have BLOCKED, “APPROVAL”(then none!) or DEACTIVATED comments, and have gone on to show PERFECTLY ORDINARY CONTRAILS, with witless comments which, apart from their abrogation of democratic accountability, DEMONSTRATE that they absolutely HAVEN’T A CLUE about ordinary CONTRAIL PROPAGATION.
I expected to find a THOROUGH STUDY of AIRPORT FACILITIES (after all, if they are SPRAYING stuff, you’d expect to find STUFF!)
WHITE materials would leave WHITE SPLASHES on AIRPORT TAXIWAYS.
TOXIC materials would give you a chance to see people wearing MASKS AND SUITS, special sealed TRUCKS, signs saying “HAZARD” – ALL SORTS OF STUFF.
It is often quite possible to walk up to aircraft and inspect them for nozzles, strange hatches, drips and stains. NO VIDEO has ever done this and made comparisons with easily-available external plans for almost every single type of aircraft.
I know that it’s a hard thing to do, but the ONLY WAY to PROVE such assertions is to FLY BEHIND A “CHEMTRAIL” AND SCOOP UP SOME FOR ANALYSIS. It should cost about $10000. Well that’s only $200 each for the RAMPANT HYPOCRITES I mention above.
Why haven’t they thought of this? I suggest it’s because they KNOW they’re onto a good wheeze. Thousands of eager terrified sheep are quite prepared to BELIEVE that the NWO is OUT TO GET THEM. WHAT A MARKET! IT’S OBVIOUS that these “people” are quite convinced that they are, indeed, EXPERTS!
They even insist that you mustn’t trust Science because it has been historically altered by the CIA! Well, that may do for the SHEEP, but it won’t do for ME.
Such a MUTILATION of TRUTH is harmful for everyone.
Now, the NWO may well be OUT TO GET US using FUNCTIONAL SCIENCE, for all I know. The ONLY WAY we can defend ourselves against such an onslaught is to use GOOD SCIENCE, OBJECTIVITY, and TRUTH.
Not BAD SCIENCE, HYPOCRISY, and LIES….

